Energy Switching Trends November 24 : Key Insights

January 20th, 2025
Energy Switching Trends November 24 : Key Insights

In November 2024, the number of people switching energy suppliers dropped a lot compared to October. ElectraLink’s new report on Changes of Supplier (CoS) shows that there were 265,000 switches. This is an 11% rise from November 2023. However, it is a big 44% decrease from the high of 475,000 switches in October 2024.

Factors Behind the October Spike

ElectraLink analysts believe that the increase in switching activity in October was due to two main reasons:

  1. Bi-Annual Contract Expiries: Many energy contracts end in April and October. This causes more people to switch their contracts during these months.
  2. Q4 Price Cap Announcement: Ofgem raised the price cap for the Q4 2024 standard variable tariff. This made lots of households look for better deals before the new prices started.

As the seasonal changes slowed down and people started thinking about holiday shopping, the switching activity in November went back to what experts call a “new normal” level.

Compare Energy Prices

Thinking about changing your energy provider?

Between 2014 and 2019, more people started to switch their energy providers. They learned about the good things that come from changing suppliers. These include getting lower prices or better services.

Year Electricity Transfers Gas Transfers
2014 3,058,000 2,282,000
2015 3,396,000 2,709,000
2016 4,420,000 3,347,000
2017 5,118,000 4,144,000
2018 5,402,000 4,517,000

Source: Ofgem

  • Key factors during this time were the growth of smaller energy suppliers that provide better rates.
  • There was also a rise in the use of price comparison websites.

Impact of the Energy Crisis (2021–2022)

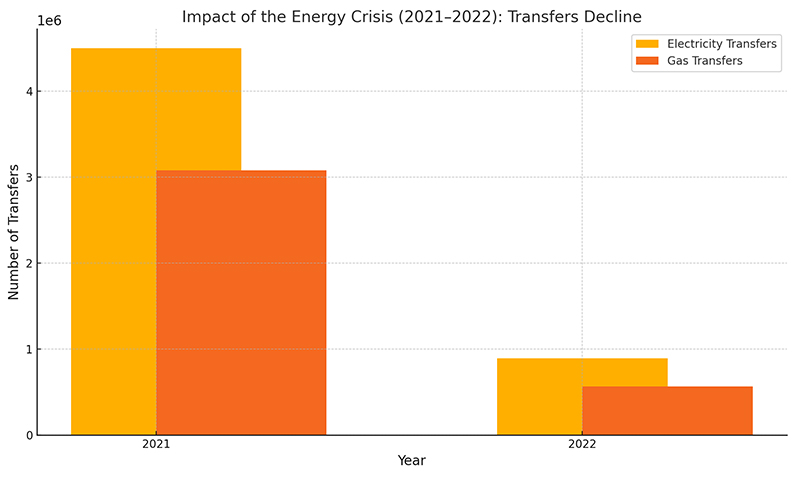
During the energy crisis, many people stopped switching suppliers. This happened because wholesale prices went up a lot. Smaller suppliers lost their businesses. Consumers were unsure about the stability of suppliers and whether the tariffs would be affordable.

Year Electricity Transfers Gas Transfers
2021 4,502,000 3,082,000
2022 893,000 566,000

Impact of Energy Crisis 2021-2022

Recovery Phase (2023–2024)

As the market became stable in 2023 and 2024, more people started switching their options. Rules like the energy price cap and better transparency helped customers find better deals.

Year Electricity Transfers Gas Transfers
2023 1,867,000 1,195,000
2024 YTD 1,128,000 880,000

How to Save Money When Switching Energy Suppliers

Switching suppliers can help you save a lot of money. This is especially true if you are on a standard variable tariff or close to the end of a fixed-term contract. Here are some tips to help you save the most:

  • Compare Prices Often: Check reliable price comparison websites, like Free Price Compare, to find the latest deals. Look at both gas and electricity rates to see which one is best for you.
  • Think About Dual-Fuel Plans: Combining gas and electricity can give you more discounts and make billing easier.
  • Check for Exit Fees: Before you switch, make sure that any early stop fees won’t cost more than what you save.
  • Watch Your Energy Use: Smart meters can show you how much energy you use. This can help you find ways to save money.
  • Choose Direct Debit Payments: Many suppliers will give you discounts if you pay by direct debit.

Breakdown of November 2024 CoS by Customer Type

ElectraLink launched a new measure in November to give better insights into switching trends among different customer types. The details showed:

Customer Type CoS Volume Share of Total
Domestic Customers 233,000 88%
SMEs (Small-Medium Enterprises) 26,000 10%
Industrial & Commercial (I&C) <6,000 2%
  • Domestic customers continued to be the main reason for switching, making up most of the changes.
  • SME customers made up a significant 10%, showing a steady need for better energy rates for businesses.
  • Industrial & Commercial (I&C) switches were very few, making up less than 2% of the total.

Compare Energy Prices

Thinking about changing your energy provider?

CoS by Supplier Type: Comparing October and November

In November 2024, the changes in trends varied between large energy providers and smaller ones.

Supplier Type November 2024 CoS Change from October 2024 Share of November CoS
Large-to-Large 175,000 -35% 66%
Large-to-Other 37,000 -58% 14%
Other-to-Large 41,000 -43% 15%
Other-to-Other 14,000 -71% 5%
  • Large-to-Large switches: They made up 66% of all CoS events in November. This is a drop of 35% from October.
  • Other-to-Other switches: They saw the biggest fall, dropping 71% from October. They only accounted for 5% of switches in November.

Insights on Market Dynamics

The big drop in November shows how switching activity changes over time. It is strongly affected by:

  • Contract renewals happen in April and October.
  • Regulators may announce changes, like price cap adjustments.

Domestic Customers Driving the Market

The importance of domestic customers in CoS activity shows they are more flexible and quicker to respond to price changes than businesses.

Large Suppliers Retain Majority Share

Large suppliers, which are those with more than 5% of the market share, still lead the market. They gain a lot from customer trust and have many resources. Meanwhile, smaller suppliers find it hard to keep their customers. This is because they have fewer competitive advantages and face higher costs to run their operations.

Challenges in the Energy Market

  • The recovery of switching volumes is good after the energy crisis in 2021-2022.
  • However, several challenges still remain.
  • Market Confidence: Consumers feel careful because they are unsure about changes in wholesale energy prices.
  • Smaller Supplier Vulnerability: Smaller suppliers struggle to keep their market share against bigger competitors.
  • Complexity of Tariffs: A lot of consumers still think tariffs, exit fees, and billing are complicated. This makes them less likely to switch suppliers.

Challenges in the Energy Market

How Can Smart Meter Data Enhance Consumer Benefits?

Smart meters have changed how energy is managed in Great Britain. They give real-time information about energy use. These devices help people understand their energy consumption. This allows them to make better choices about how they use energy. As a result, they can enjoy many benefits.

1. Better Control Over Energy Usage

Smart meters show your energy use in kilowatt-hours (kWh) right away. This helps households and small businesses see how much energy they use each day. With this information, you can find out what activities use a lot of energy. Then, you can change your habits to save on energy bills.

  • A household in the UK can save money by using large appliances when the demand for electricity is low. They can do this by checking their smart meter data.

2. Accurate Energy Bills

Smart meters calculate electricity and gas prices based on real usage, not estimates. This kind of transparency helps fix billing mistakes that used to happen with older meters.

  • Smart meters help by giving accurate usage data to suppliers. This makes monthly CoS reporting easier for regulatory bodies such as Ofgem.

3. Facilitating Energy Supplier Switching

Smart meter data helps people make smarter choices about changing their energy suppliers. With clear CoS figures from platforms like EMPRIS, they feel more confident to switch. This platform gives a detailed look at wholesale market indicators, such as electricity generation costs and market prices.

4. Supporting Small Businesses

Small businesses can gain a lot from using smart meters. These meters allow them to track how much energy they use. By doing this, they can cut down on waste and improve their energy supply deals. This is especially helpful during times when market forces change, such as during the energy price crisis.

5. Contributions to the Retail Energy Market

Smart meters provide important data that helps understand the energy market. This data allows suppliers to predict demand more accurately. As a result, trade sales and electricity generation become more efficient. For example, smart meter data helps set monthly CoS rates and shows trends in total CoS events.

How Do Price Cap Announcements Impact Switching Behaviour?

Price cap announcements are very important for how people make choices in the UK energy market. These caps, created by Ofgem, control how much energy suppliers can charge for standard variable tariffs. This can have big effects on consumers and the market as a whole.

1. Immediate Spike in Switching Rates

When news comes out about higher energy prices, many customers quickly change suppliers to get fixed-rate plans. CoS data from last year shows that there were a lot more switches after the price changes in September and December.

  • For example, when a price cap change was announced, there were 265,000 switches in one month. This shows that households were making active decisions.

2. Influence on Market Forces

Price caps change the wholesale gas prices and electricity prices. This forces suppliers to change their rates. Big suppliers usually keep governance protections to keep customers. On the other hand, small suppliers might find it hard to compete. This situation can lead to changes in the retail energy market.

3. Supplier of Last Resort (SoLR) Processes

Price cap changes can sometimes cause suppliers to fail. This can start SoLR processes. When this happens, consumers get switched to new suppliers automatically. This can change CoS figures and create ups and downs in the energy market.

Price cap announcements in months like June or December can change how people behave as consumers. Some households may switch electricity suppliers more often. This change often depends on local electricity generation costs and what is happening in the wholesale market.

5. Long-Term Consumer Impact

Price caps can help people quickly during a time when energy prices are high. They also make customers look into the good things about smart meters. These meters give better transparency. This helps people understand market prices more clearly, check tariffs, and choose to switch plans when they need to.

FAQs About Energy Supplier Switching in November 2024

Why did energy supplier switching rates drop in November 2024?

The decline happened mainly because of the seasonal changes in activity. Every October, people’s contracts end, causing a short increase in activity. Also, in November, shoppers’ attention switched to holiday spending.

How do domestic and business customers differ in switching behaviour?

Domestic customers lead the way in switching providers because they are more sensitive to price changes. On the other hand, SMEs and I&C customers switch providers less often. This is because they have longer contracts and fewer flexible choices.

Large suppliers hold most of the share in switching events. They gain this advantage because people trust them and they spend a lot on marketing. On the other hand, smaller suppliers struggle a lot to keep their customers.

How does the Ofgem price cap affect switching rates?

The price cap gives clear costs for standard variable tariffs. This makes more consumers look for better deals when the caps change.

Can businesses benefit from switching suppliers like domestic customers?

Yes, both SMEs and larger businesses can gain from competitive rates. However, switching options might be more complicated for them because of specific contracts.

Compare Energy Prices

Thinking about changing your energy provider?

4000+ reviews