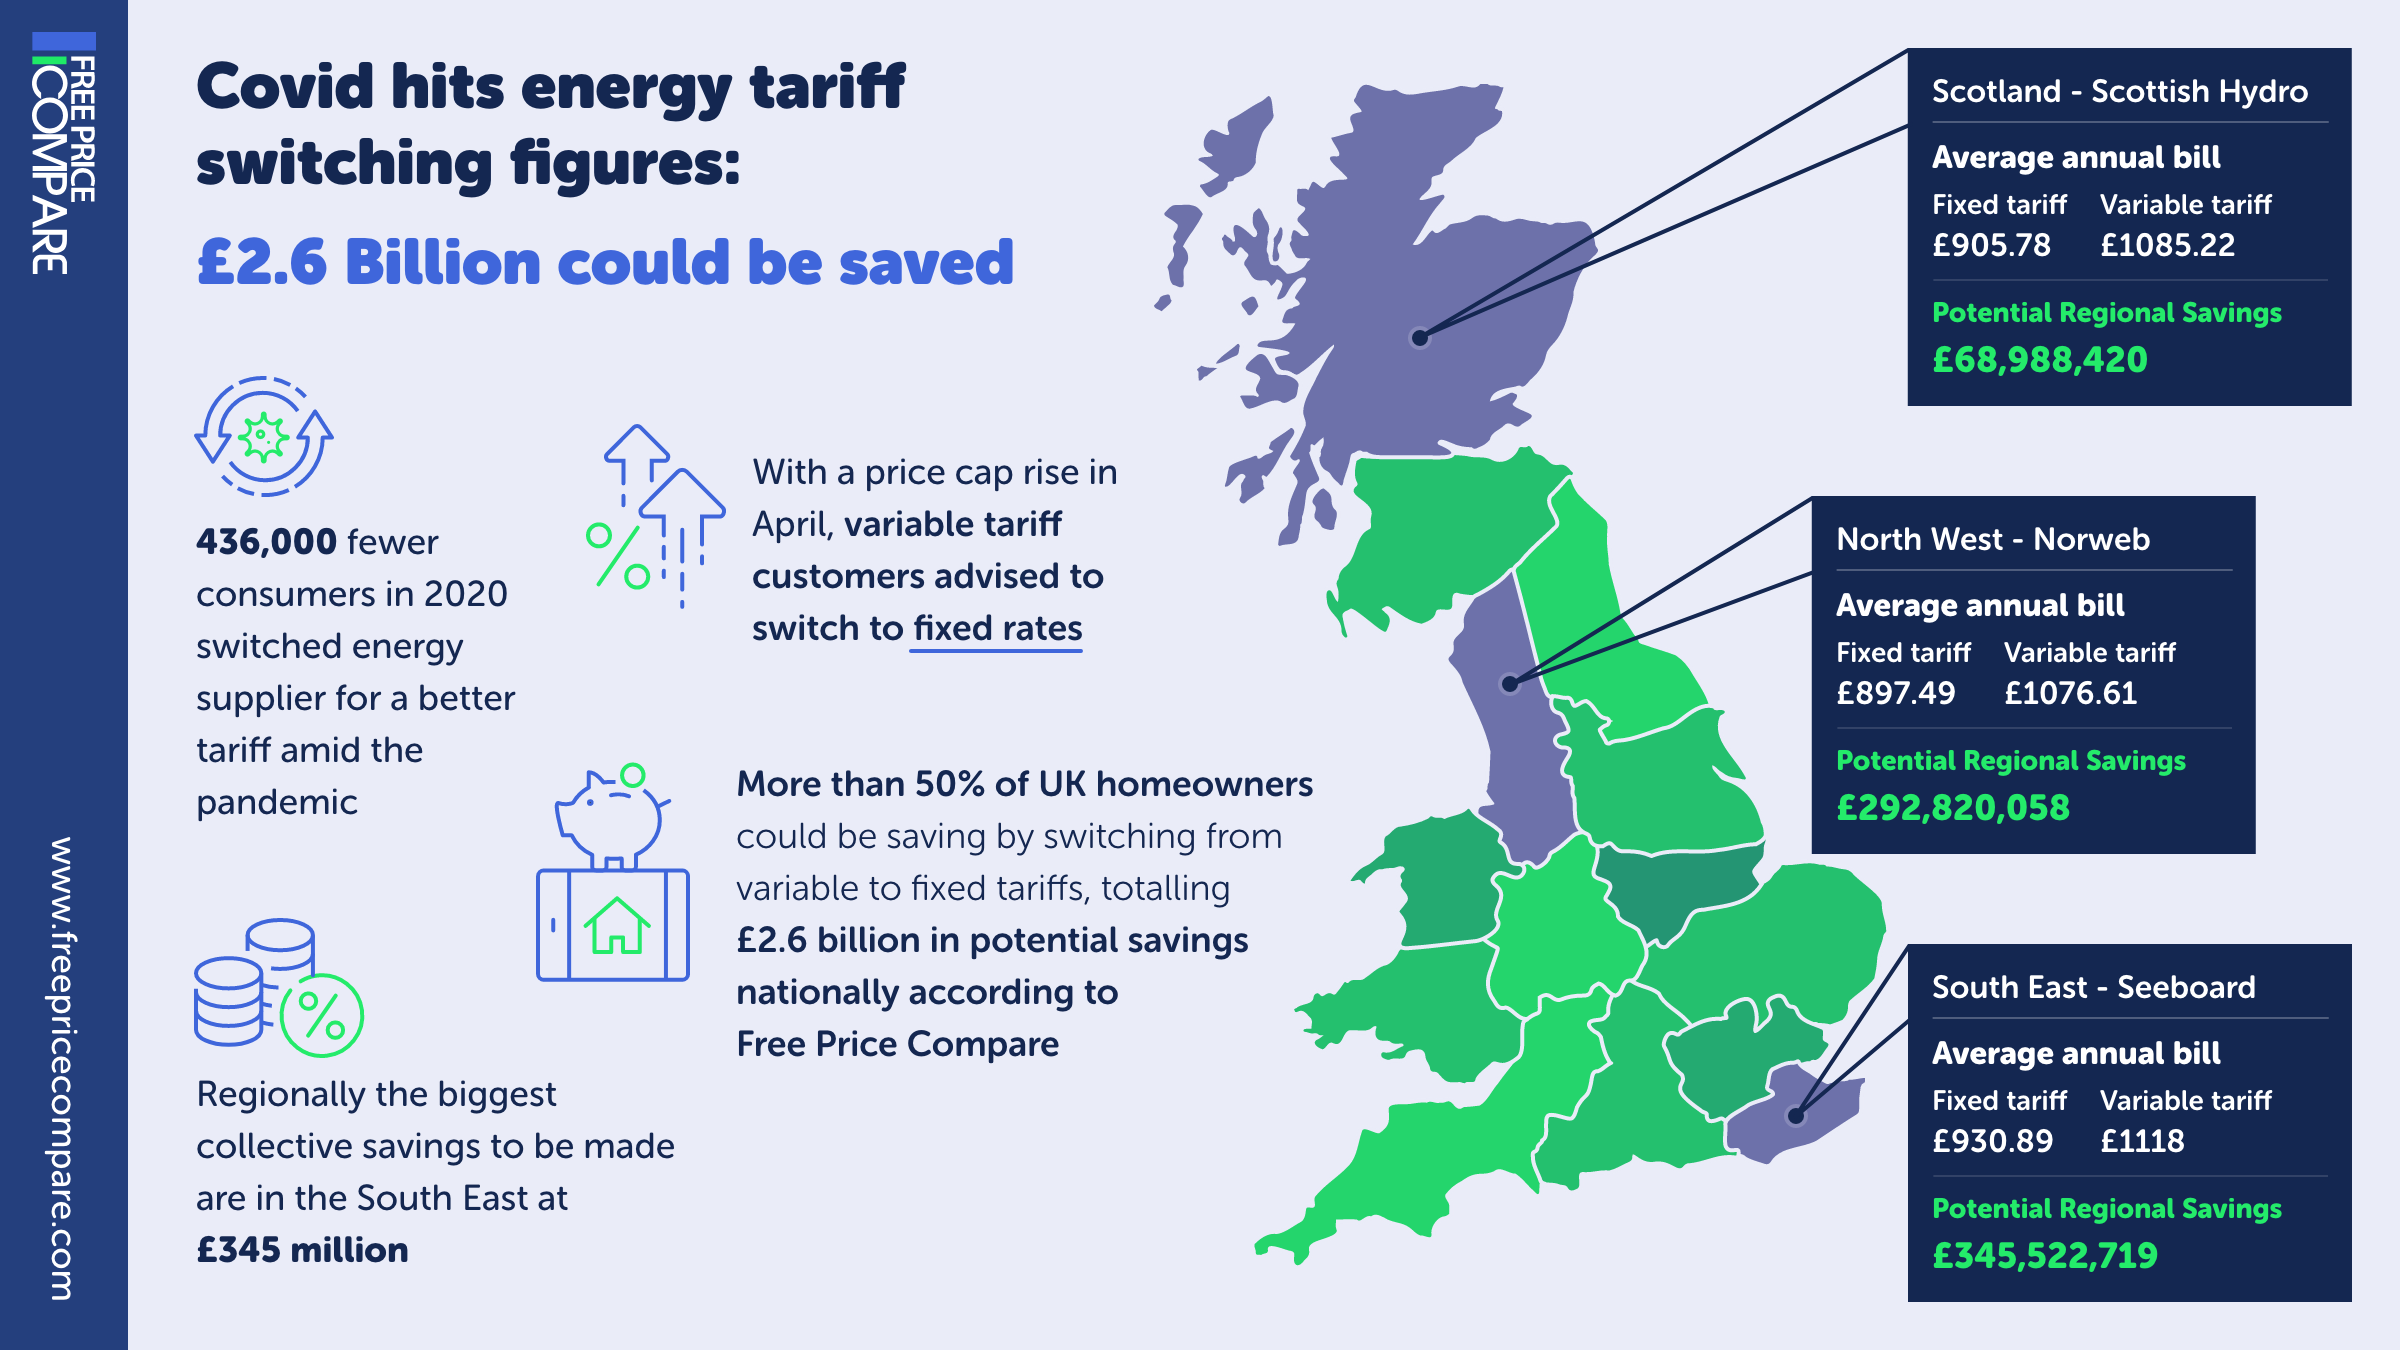
(Scotland) Scottish Hydro | |
Average annual bill | |
Fixed tariff | Variable tariff |
£905.78 | £1085.22 |
Potential Regional Savings | |
£68,988,420 |
(Scotland) Scottish Power | |
Average annual bill | |
Fixed tariff | Variable tariff |
£894.37 | £1073.14 |
Potential Regional Savings | |
£16,097,298 |
(North East) Northern | |
Average annual bill | |
Fixed tariff | Variable tariff |
£894.37 | £108,641,534 |
Potential Regional Savings | |
£143,488,818 |
(North West) Norweb | |
Average annual bill | |
Fixed tariff | Variable tariff |
£897.49 | £1076.61 |
Potential Regional Savings | |
£292,820,058 |
Yorkshire | |
Average annual bill | |
Fixed tariff | Variable tariff |
£895.85 | £1067.53 |
Potential Regional Savings | |
£220,024,329 |
East Midlands | |
Average annual bill | |
Fixed tariff | Variable tariff |
£878.01 | £1056.27 |
Potential Regional Savings | |
£220,614,462 |
Midlands | |
Average annual bill | |
Fixed tariff | Variable tariff |
£893.4 | £1077 |
Potential Regional Savings | |
£291,377,591 |
(Wales) Manweb | |
Average annual bill | |
Fixed tariff | Variable tariff |
£941.04 | £1128.57 |
Potential Regional Savings | |
£37,895,088 |
(Wales) Swalec | |
Average annual bill | |
Fixed tariff | Variable tariff |
£916.56 | £1092.93 |
Potential Regional Savings | |
£88,421,872 |
(South West) Sweb | |
Average annual bill | |
Fixed tariff | Variable tariff |
£815.14 | £874.49 |
Potential Regional Savings | |
£224,907,202 |
Southern | |
Average annual bill | |
Fixed tariff | Variable tariff |
£912.5 | £1094.11 |
Potential Regional Savings | |
£265,027,560 |
London | |
Average annual bill | |
Fixed tariff | Variable tariff |
£904.32 | £1095 |
Potential Regional Savings | |
£312,713,243 |
(East) Eastern | |
Average annual bill | |
Fixed tariff | Variable tariff |
£900.59 | £1081.32 |
Potential Regional Savings | |
£244,962,197 |
(South East) Seeboard | |
Average annual bill | |
Fixed tariff | Variable tariff |
£930.89 | £1118 |
Potential Regional Savings | |
£345,522,719 |
“2020 was certainly a very difficult year for many, with COVID-19 having a negative impact on many household incomes. Although you would think this might mean more consumers reviewing their regular spending and monthly direct debits, when it comes to switching to cheaper energy tariffs with an alternative supplier, fewer people were doing so last year – in fact over 436,000 less than in 2019. This trend seems to be continuing into 2021, and could be purely because consumers have more important things on their minds than energy bills – despite the fact that savings could be considerable during such uncertain times when many of us are also working from home using more gas and electricity.” Shailesh Ramani, 2021
Interactive map and infographic data sources include fixed tariff prices from Free Price Compare suppliers, variable rates from energy providers regionally, UK household figures from the Office for National Statistics. Compare Energy Prices
<iframe src="https://freepricecompare.com/ukmap/" width="100%" ></iframe>
Submit your review | |
1 2 3 4 5 | |
Submit Cancel |